Here's another good one.....

bornaneer

All-Conference
Jan 23, 2014
30,946
1,661
113
How ignorant can some people be. I guess they are clueless about Hurricane Science.

From the idiot Beyoncé: "The effects of climate change are playing out around the world every day," she stated. "Just this past week we have seen an 8.1 earthquake in Mexico ".

From Matt Lauer: "Hurricane Irma was the most powerful Atlantic storm ever recorded, cutting a path of destruction across the Caribbean, the U.S. Virgin Islands and then setting its sights on the U.S. mainland."
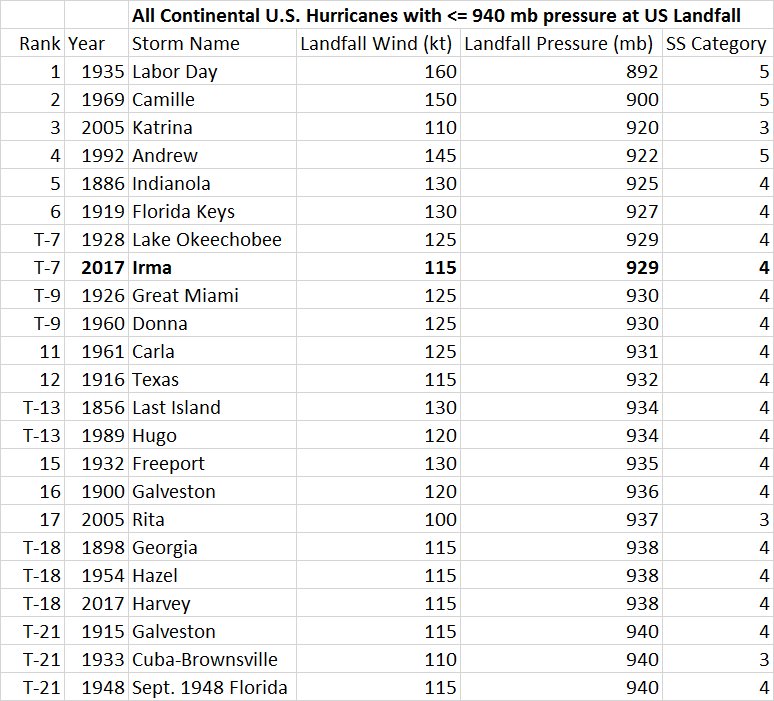
BUT.......Hurricane Irma is actually tied for the 7th strongest hurricane ever recorded.
 

bornaneer

All-Conference
Jan 23, 2014
30,946
1,661
113
Actually the strength and frequency of hurricanes will be impacted by climate change
You are missing the point. I think you,unlike the low IQ moron Beyoncé are smart enough to know that climate change and earthquakes are not linked.
Also.....Matt Lauer lied......the scientific data does not lie..... Irma is not the "most powerful Atlantic storm ever recorded".
Yes...we all know that climate affects hurricanes just like it has done since the beginning of time.
 

Airport

All-American
Dec 12, 2001
86,295
6,996
113
You are missing the point. I think you,unlike the low IQ moron Beyoncé are smart enough to know that climate change and earthquakes are not linked.
Also.....Matt Lauer lied......the scientific data does not lie..... Irma is not the "most powerful Atlantic storm ever recorded".
Yes...we all know that climate affects hurricanes just like it has done since the beginning of time.
There's a net decrease in hurricanes, so there's that. The destructive force of hurricanes is more due to increase population than anything else. I beleive the most powerful hurricane "recorded" was in 1935. The New deal caused that.
 

Boomboom521

Redshirt
Mar 14, 2014
20,115
6
0
So, since there has been a decrease in the number of hurricanes, we owe that to climate change?
When is that going to happen? It was supposed to happen over a decade ago.
 

WVUCOOPER

Redshirt
Dec 10, 2002
55,556
40
31
Not to play Lauer's advocate here, but he did say most powerful ATLANTIC hurricane. Not the most powerful hurricane to make landfall in the US. I believe it was the most powerful, at one point, but the direct hits on those islands weakened it before US landfall.
 

DvlDog4WVU

All-Conference
Feb 2, 2008
47,230
3,298
113
Hurricanes, tropical storms, and cyclones have increased in frequency.
Weird that both of those charts stop at 2005 which was the highest year on record with 28 named storms. Almost like deniers charting with El Niño to throw off the increase.

I posted the data last week that showed the Top 10 years of Hurricanes and Top 10 Major Hurricanes, the data I posted from Wunderground, which is about as left leaning on climate change as someone who hasn't had their V8 yet shows no real increase. It's pretty level since 1881.
 

Airport

All-American
Dec 12, 2001
86,295
6,996
113
You're reading propaganda my friend.
But since 2005, while there have been ample number of hurricanes overall in the Atlantic, the United States itself has been lucky. Before Hurricane Harvey, the continental United States had not been hit by a Category 3 or higher “major hurricane” for 12 years — dating all the way back to 2005’s Hurricane Wilma.

This pattern of activity raises two questions. First, why does Atlantic hurricane activity seemingly switch on and off over decades? And second: Why, during a period when that activity was still presumably “on,” did the United States avoid being hit by strong storms for so long?
 

Airport

All-American
Dec 12, 2001
86,295
6,996
113
Weird that both of those charts stop at 2005 which was the highest year on record with 28 named storms. Almost like deniers charting with El Niño to throw off the increase.

I posted the data last week that showed the Top 10 years of Hurricanes and Top 10 Major Hurricanes, the data I posted from Wunderground, which is about as left leaning on climate change as someone who hasn't had their V8 yet shows no real increase. It's pretty level since 1881.
There's been a net decrease in hurricanes since 2005, an inconvienent truth.
 

Airport

All-American
Dec 12, 2001
86,295
6,996
113
Not to play Lauer's advocate here, but he did say most powerful ATLANTIC hurricane. Not the most powerful hurricane to make landfall in the US. I believe it was the most powerful, at one point, but the direct hits on those islands weakened it before US landfall.
Camille is the most powerful in my lifetime and there just wasn't the population back then that there is now.
 

DvlDog4WVU

All-Conference
Feb 2, 2008
47,230
3,298
113
There's been a net decrease in hurricanes since 2005, an inconvienent truth.
2005 was the highest year on record with 15, followed up by 2010 with 12 and then 1969 with 12 and 1887, 1950, 1998, 1995 all with 11.

1950 had the most major Hurricanes with 8. 2005 had 7. 99, 96, 64, 61, 55, and 26 all had 6.

The ACE index (the truest indicator) again has 2005 (250) as the highest followed up by 1950 (243). Of the top 10 in this category, 30% are within the last 20 years.

The one argument in correlative concurrence with the hypothesis is the most named storms however, the actual hypothesis says the storms should be increasing in ferocity, which the major hurricane and hurricane numbers don't jive with.

The reality is we should be seeing an increas in both numbers and ferocity, but we aren't and we can't explain why. I speculate it has something to do with depression formations over Africa offsetting some of what should be occurring.
 

Airport

All-American
Dec 12, 2001
86,295
6,996
113
:sunglasses::sunglasses:
2005 was the highest year on record with 15, followed up by 2010 with 12 and then 1969 with 12 and 1887, 1950, 1998, 1995 all with 11.

1950 had the most major Hurricanes with 8. 2005 had 7. 99, 96, 64, 61, 55, and 26 all had 6.

The ACE index (the truest indicator) again has 2005 (250) as the highest followed up by 1950 (243). Of the top 10 in this category, 30% are within the last 20 years.

The one argument in correlative concurrence with the hypothesis is the most named storms however, the actual hypothesis says the storms should be increasing in ferocity, which the major hurricane and hurricane numbers don't jive with.

The reality is we should be seeing an increas in both numbers and ferocity, but we aren't and we can't explain why. I speculate it has something to do with depression formations over Africa offsetting some of what should be occurring.
There was increased depression in the u s from 2008 to 2016:sunglasses:
 

Boomboom521

Redshirt
Mar 14, 2014
20,115
6
0
Atlantic basin
Individual years with the numbers in each category

Year Named
Storms
Hurricanes Major
Hurricanes
ACE
^ Click header for diagram ^
1851 6 3 1 36
1852 5 5 1 73
1853 8 4 2 76
1854 5 3 1 31
1855 5 4 1 18
1856 6 4 2 49
1857 4 3 0 40
1858 6 6 0 45
1859 8 7 1 56
1860 7 6 1 62
1861 8 6 0 50
1862 6 3 0 46
1863 9 5 0 50
1864 5 3 0 27
1865 7 3 0 49
1866 7 6 1 84
1867 9 7 1 60
1868 4 3 0 35
1869 10 7 1 51
1870 11 10 2 88
1871 8 6 2 88
1872 5 4 0 65
1873 5 3 2 69
1874 7 4 0 47
1875 6 5 1 72
1876 5 4 2 57
1877 8 3 1 73
1878 12 10 2 181
1879 8 6 2 64
1880 11 9 2 131
1881 7 4 0 59
1882 6 4 2 59
1883 4 3 2 67
1884 4 4 1 72
1885 8 6 0 58
1886 12 10 4 166
1887 19 11 2 181
1888 9 6 2 85
1889 9 6 0 104
1890 4 2 1 33
1891 10 7 1 116
1892 9 5 0 116
1893 12 10 5 231
1894 7 5 4 135
1895 6 2 0 69
1896 7 6 2 136
1897 6 3 0 55
1898 11 5 1 113
1899 10 5 2 151
1900 7 3 2 83
1901 13 6 0 99
1902 5 3 0 33
1903 10 7 1 102
1904 6 4 0 30
1905 5 1 1 28
1906 11 6 3 163
1907 5 0 0 13
1908 10 6 1 95
1909 12 6 4 93
1910 5 3 1 64
1911 6 3 0 35
1912 7 4 1 57
1913 6 4 0 36
1914 1 0 0 3
1915 6 5 3 130
1916 15 10 5 144
1917 4 2 2 61
1918 6 4 1 40
1919 5 2 1 55
1920 5 4 0 30
1921 7 5 2 87
1922 5 3 1 55
1923 9 4 1 49
1924 11 5 2 100
1925 4 1 0 7
1926 11 8 6 230
1927 8 4 1 56
1928 6 4 1 83
1929 5 3 1 48
1930 3 2 2 50
1931 13 3 1 48
1932 15 6 4 170
1933 20 11 6 259
1934 13 7 1 48
1935 8 5 3 106
1936 17 7 1 100
1937 11 4 1 66
1938 9 4 2 78
1939 6 3 1 34
1940 9 6 0 68
1941 6 4 3 52
1942 11 4 1 63
1943 10 5 2 94
1944 14 8 3 104
1945 11 5 2 63
1946 6 3 1 22
1947 9 5 2 112
1948 9 6 4 106
1949 13 7 3 98
1950 13 11 8 243
1951 10 8 5 137
1952 7 6 3 87
1953 14 6 4 104
1954 11 8 2 113
1955 12 9 6 199
1956 8 4 2 54
1957 8 3 2 84
1958 10 7 5 121
1959 11 7 2 77
1960 7 4 2 88
1961 11 8 7 205
1962 5 3 1 36
1963 9 7 2 118
1964 12 6 6 170
1965 6 4 1 84
1966 11 7 3 145
1967 8 6 1 122
1968 8 4 0 45
1969 18 12 5 166
1970 10 5 2 40
1971 13 6 1 97
1972 7 3 0 36
1973 8 4 1 48
1974 11 4 2 68
1975 9 6 3 76
1976 10 6 2 84
1977 6 5 1 25
1978 12 5 2 63
1979 9 5 2 93
1980 11 9 2 149
1981 12 7 3 100
1982 6 2 1 32
1983 4 3 1 17
1984 13 5 1 84
1985 11 7 3 88
1986 6 4 0 36
1987 7 3 1 34
1988 12 5 3 103
1989 11 7 2 135
1990 14 8 1 97
1991 8 4 2 36
1992 7 4 1 76
1993 8 4 1 39
1994 7 3 0 32
1995 19 11 5 228
1996 13 9 6 166
1997 8 3 1 41
1998 14 10 3 182
1999 12 8 5 177
2000 15 8 3 119
2001 15 9 4 110
2002 12 4 2 67
2003 16 7 3 176
2004 15 9 6 227
2005 28 15 7 250
2006 10 5 2 79
2007 15 6 2 74
2008 16 8 5 146
2009 9 3 2 53
2010 19 12 5 165
2011 19 7 4 126
2012 19 10 2 129
2013 14 2 0 36
2014 8 6 2 67
2015 11 4 2 63
2016 15 7 4 141
Average
1968-2016
11.8 6.2 2.4 95.4
Standard Deviation
1968-2016
4.57 2.90 1.70 58.9
 

Boomboom521

Redshirt
Mar 14, 2014
20,115
6
0
That didn't work out. **** it! Believe what you want to believe. You're going to anyway.

Let's just agree that Beyoncé is no genius
 

TarHeelEer

Freshman
Dec 15, 2002
89,304
53
48
Atlantic basin
Individual years with the numbers in each category

Year Named
Storms
Hurricanes Major
Hurricanes
ACE
^ Click header for diagram ^
1851 6 3 1 36
1852 5 5 1 73
1853 8 4 2 76
1854 5 3 1 31
1855 5 4 1 18
1856 6 4 2 49
1857 4 3 0 40
1858 6 6 0 45
1859 8 7 1 56
1860 7 6 1 62
1861 8 6 0 50
1862 6 3 0 46
1863 9 5 0 50
1864 5 3 0 27
1865 7 3 0 49
1866 7 6 1 84
1867 9 7 1 60
1868 4 3 0 35
1869 10 7 1 51
1870 11 10 2 88
1871 8 6 2 88
1872 5 4 0 65
1873 5 3 2 69
1874 7 4 0 47
1875 6 5 1 72
1876 5 4 2 57
1877 8 3 1 73
1878 12 10 2 181
1879 8 6 2 64
1880 11 9 2 131
1881 7 4 0 59
1882 6 4 2 59
1883 4 3 2 67
1884 4 4 1 72
1885 8 6 0 58
1886 12 10 4 166
1887 19 11 2 181
1888 9 6 2 85
1889 9 6 0 104
1890 4 2 1 33
1891 10 7 1 116
1892 9 5 0 116
1893 12 10 5 231
1894 7 5 4 135
1895 6 2 0 69
1896 7 6 2 136
1897 6 3 0 55
1898 11 5 1 113
1899 10 5 2 151
1900 7 3 2 83
1901 13 6 0 99
1902 5 3 0 33
1903 10 7 1 102
1904 6 4 0 30
1905 5 1 1 28
1906 11 6 3 163
1907 5 0 0 13
1908 10 6 1 95
1909 12 6 4 93
1910 5 3 1 64
1911 6 3 0 35
1912 7 4 1 57
1913 6 4 0 36
1914 1 0 0 3
1915 6 5 3 130
1916 15 10 5 144
1917 4 2 2 61
1918 6 4 1 40
1919 5 2 1 55
1920 5 4 0 30
1921 7 5 2 87
1922 5 3 1 55
1923 9 4 1 49
1924 11 5 2 100
1925 4 1 0 7
1926 11 8 6 230
1927 8 4 1 56
1928 6 4 1 83
1929 5 3 1 48
1930 3 2 2 50
1931 13 3 1 48
1932 15 6 4 170
1933 20 11 6 259
1934 13 7 1 48
1935 8 5 3 106
1936 17 7 1 100
1937 11 4 1 66
1938 9 4 2 78
1939 6 3 1 34
1940 9 6 0 68
1941 6 4 3 52
1942 11 4 1 63
1943 10 5 2 94
1944 14 8 3 104
1945 11 5 2 63
1946 6 3 1 22
1947 9 5 2 112
1948 9 6 4 106
1949 13 7 3 98
1950 13 11 8 243
1951 10 8 5 137
1952 7 6 3 87
1953 14 6 4 104
1954 11 8 2 113
1955 12 9 6 199
1956 8 4 2 54
1957 8 3 2 84
1958 10 7 5 121
1959 11 7 2 77
1960 7 4 2 88
1961 11 8 7 205
1962 5 3 1 36
1963 9 7 2 118
1964 12 6 6 170
1965 6 4 1 84
1966 11 7 3 145
1967 8 6 1 122
1968 8 4 0 45
1969 18 12 5 166
1970 10 5 2 40
1971 13 6 1 97
1972 7 3 0 36
1973 8 4 1 48
1974 11 4 2 68
1975 9 6 3 76
1976 10 6 2 84
1977 6 5 1 25
1978 12 5 2 63
1979 9 5 2 93
1980 11 9 2 149
1981 12 7 3 100
1982 6 2 1 32
1983 4 3 1 17
1984 13 5 1 84
1985 11 7 3 88
1986 6 4 0 36
1987 7 3 1 34
1988 12 5 3 103
1989 11 7 2 135
1990 14 8 1 97
1991 8 4 2 36
1992 7 4 1 76
1993 8 4 1 39
1994 7 3 0 32
1995 19 11 5 228
1996 13 9 6 166
1997 8 3 1 41
1998 14 10 3 182
1999 12 8 5 177
2000 15 8 3 119
2001 15 9 4 110
2002 12 4 2 67
2003 16 7 3 176
2004 15 9 6 227
2005 28 15 7 250
2006 10 5 2 79
2007 15 6 2 74
2008 16 8 5 146
2009 9 3 2 53
2010 19 12 5 165
2011 19 7 4 126
2012 19 10 2 129
2013 14 2 0 36
2014 8 6 2 67
2015 11 4 2 63
2016 15 7 4 141
Average
1968-2016
11.8 6.2 2.4 95.4
Standard Deviation
1968-2016
4.57 2.90 1.70 58.9

"Thus, the following records for the period of reliable data hold for the entire Atlantic basin (from 1966-2016)"
 

Shirley Knott

Redshirt
May 26, 2017
12,831
0
0
You are missing the point. I think you,unlike the low IQ moron Beyoncé are smart enough to know that climate change and earthquakes are not linked.
Also.....Matt Lauer lied......the scientific data does not lie..... Irma is not the "most powerful Atlantic storm ever recorded".
Yes...we all know that climate affects hurricanes just like it has done since the beginning of time.
Evidently global warming has an effect on leftists also... I suspect it bakes brain cavities....
 

Boomboom521

Redshirt
Mar 14, 2014
20,115
6
0
The intensity of a hurricane isn’t impacted by the temperature of the ocean water over which it travels?
 

Keyser76

Freshman
Apr 7, 2010
11,912
58
0
Lol, Beyoncé, Donnie, I wouldn't go to either one for information about anything except maybe I'd ask Beyoncé for business advice over Donnie since I'm sure she is worth more.
 

Boomboom521

Redshirt
Mar 14, 2014
20,115
6
0
Evidently global warming has an effect on leftists also... I suspect it bakes brain cavities....
Because it’s a giant international conspiracy to make money and prevent chubby fools from enjoying their cheeseburgers and big manly suv’s isn’t it?
 

dave

Senior
May 29, 2001
60,601
816
113
Because it’s a giant international conspiracy to make money and prevent chubby fools from enjoying their cheeseburgers and big manly suv’s isn’t it?
Its mostly just a money grab by con men playing off everyones fear of fossil fuels. Get rich off Big Oil.