OT: Stock and Investment Thread

Jul 3, 2025
335
215
43
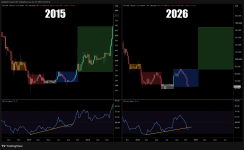
That tweet indicates we have a year of chop ahead. Right on schedule
Think Tim Robinson GIF by NETFLIX
 

Rutgers Chris

All-American
Nov 29, 2005
6,038
7,366
97
I don't see a similar run up on previous charts.

Don't know if the scale is the same for each year. You do see the down ward trend, but this pop, and then give back, actually suggests more volatility. Though again, scale, which I'm doubting is similar year to year.
Scale definitely seems to be different each cycle. That’s what I meant by less volatility. Don’t see the same extreme moves up or down as years past. Summer 2015 is closest run up and give back pattern
CD31CB72-4310-47E4-B724-47952B474E7B.png
 
The Knight Report

Latest

  1. 01 The Knight Report Rutgers Basketball HC Brandin Knight's Notre Dame Postgame Press Conference

  2. 02 The Knight Report Rutgers Basketball falls to Notre Dame in wild Players Era 8 OT showdown
  3. 03 The Knight Report The Knight Report - Ask The Experts Chat: November 18th Edition

  4. 04 The Knight Report Wrestling Rutgers Wrestlers in the latest InterMat Rankings - Week Three

  5. 05 The Knight Report Basketball How to watch Rutgers / Notre Dame; Pregame Info, More: Gameday Central