WTT is in the rear view mirror and Final X is weeks away, so I dusted off some NCAA data to keep myself entertained in the between times.
The Seed (Round) rows group the seeds into the rounds they would finish if everything went chalk (or at least if their individual results went chalk).
The Round columns are where they actually finished. So the top 8 seeds finish as AA's 74% of the time, finish in the blood round 16% of the time, etc.
The data is from the 33 seed era only (2019 - 2025). The averages sum horizontally, not vertically.
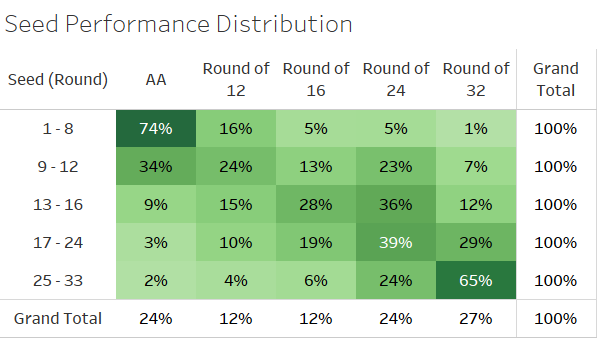
The Seed (Round) rows group the seeds into the rounds they would finish if everything went chalk (or at least if their individual results went chalk).
The Round columns are where they actually finished. So the top 8 seeds finish as AA's 74% of the time, finish in the blood round 16% of the time, etc.
The data is from the 33 seed era only (2019 - 2025). The averages sum horizontally, not vertically.
- For the gamblers in the audience it looks like the 9-12 seeds are the value play as they finish on the podium more often than the blood round. The opposite should be expected.
- On the flip side, avoid they 13-16 seeds who finish one round short of expectations more often than on seed-based expectations.