Really does look like closing bars, restaurants, and schools holds the key:
https://www.nytimes.com/2020/03/30/health/coronavirus-restrictions-fevers.html
https://www.nytimes.com/2020/03/30/health/coronavirus-restrictions-fevers.html
Hopefully we can all keep our patience and do our part by staying home as much as possible.Makes me hopeful we're starting to flatten the curve. One of the things I've been doing is tracking the growth factor, that is, dividing the current day's number of new infections to the prior day's number.
By doing this we can get a general sense of if transmission is accelerating or decelerating.
If the GF is above 1.0, we're still solidly in exponential growth, and still could have orders of magnitude more infections to go.
But if we can start to live at or below 1.0, we reach the inflection point, and start to see the curve flatten and then decline. Once the inflection point has been reached, we're essentially as the half-way point in terms of #'s of infections.
Now to be clear, every single day in the month of March we've had a larger # of new infections than the prior day. But the rate of that growth seems to have slowed. Going back ten days, the five day growth factor for 3/22-3/26 was 17,224/9,400 (roughly 1.83). The growth factor for the next five days, 3/26-3/30 was only 1.18. The growth factor for the last two days was only 1.02.
The medium term and short term trends seem to suggest that rates of transmission are in fact slowing.
Hopefully we can all keep our patience and do our part by staying home as much as possible.
Yes it is. These graphs below show 10 & 40 + days of stats that show exponential growth ending are being ignored. See graphsMakes me hopeful we're starting to flatten the curve. One of the things I've been doing is tracking the growth factor, that is, dividing the current day's number of new infections to the prior day's number.
By doing this we can get a general sense of if transmission is accelerating or decelerating.
If the GF is above 1.0, we're still solidly in exponential growth, and still could have orders of magnitude more infections to go.
But if we can start to live at or below 1.0, we reach the inflection point, and start to see the curve flatten and then decline. Once the inflection point has been reached, we're essentially as the half-way point in terms of #'s of infections.
Now to be clear, every single day in the month of March we've had a larger # of new infections than the prior day. But the rate of that growth seems to have slowed. Going back ten days, the five day growth factor for 3/22-3/26 was 17,224/9,400 (roughly 1.83). The growth factor for the next five days, 3/26-3/30 was only 1.18. The growth factor for the last two days was only 1.02.
The medium term and short term trends seem to suggest that rates of transmission are in fact slowing.
Yes it is. These graphs below show 10 & 40 + days of stats that show exponential growth ending are being ignored. See graphs
projections the Government is using don’t take these trends into account
https://covid19.healthdata.org/projections
most up to date stats and to see the graphs used below
https://www.worldometers.info/coronavirus
projections the Government is using
https://covid19.healthdata.org/projections
most up to date stats
https://www.worldometers.info/coronavirus
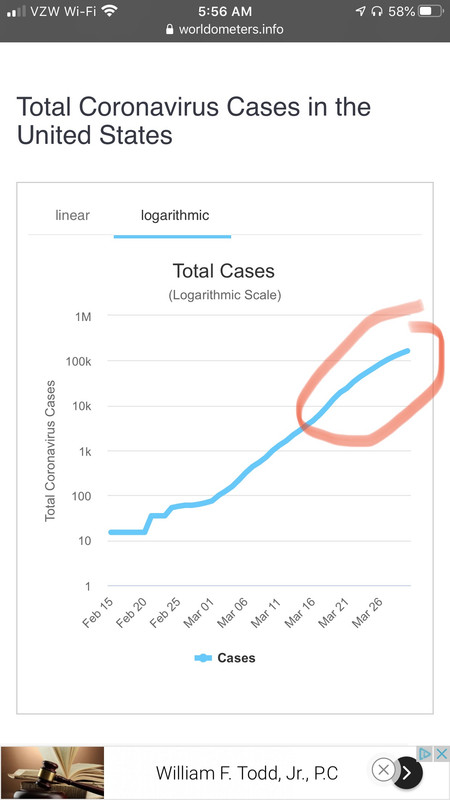
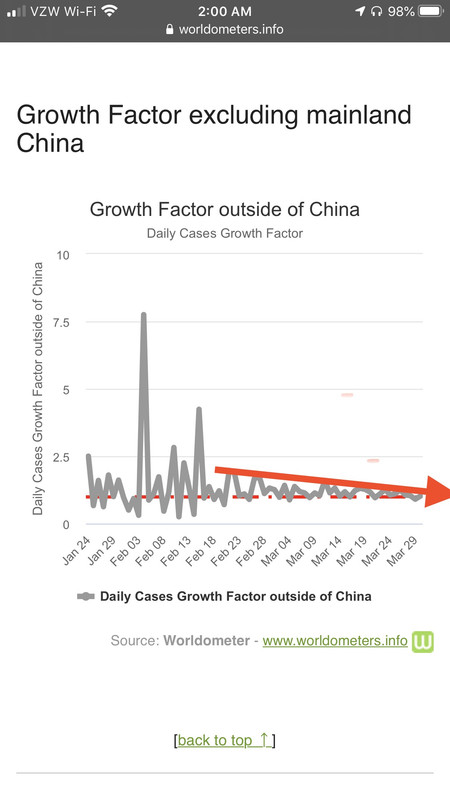
two very positive 10+ day trends in these graphs:
Graph 1 is a clear down turn over the last tens days of new cases in the USA. The graph is clearly curling downward. This is a clear sign exponential growth is coming to an end in the USA
Graph 2 is a clear sign that exponential growth has declined in rest of the world even when you remove China from the data. This has happened over the last 40 days and it should drop below 1.0 permanently within a week if the trend continues. That will be the end of exponential growth.
Uh America is one of the graphs and it is a CLEAR 10 day trend! How the F is that ignoring what’s happening in America. I’ll sit back an wait as this will be needing some serious spin from your corner to explain 10 days of data away!It seems like you are only looking at what you want to be true and ignoring what’s happening in America.
It seems like you are only looking at what you want to be true and ignoring what’s happening in America.
With the growth rate now basically dropping below 1.0 exponential growth is over before all the stupid panic laws have been made active. Just SayinI've been as brutally honest about the data on here for weeks, but I have to admit that I think there is potential here.
Where the disagreement with BigTimeTiger comes in is what to do with the data. It seems that BTT's response to the encouraging news is "see? This is all a bunch of BS to sink Trump and is unnecessary."
What I and the original OP are saying is that these social distancing measures are working, and now is the time to truly ramp these measures up to finally flatten the curve.
I've been as brutally honest about the data on here for weeks, but I have to admit that I think there is potential here.
Where the disagreement with BigTimeTiger comes in is what to do with the data. It seems that BTT's response to the encouraging news is "see? This is all a bunch of BS to sink Trump and is unnecessary."
What I and the original OP are saying is that these social distancing measures are working, and now is the time to truly ramp these measures up to finally flatten the curve.
With the growth rate now basically dropping below 1.0 exponential growth is over before all the stupid panic laws have been made active. Just Sayin
WTF do you think this was?!Right, but I want to see a graph with what’s specifically happening in America, considering we can’t trust the numbers from a lot of other countries.
Did I say stop social distancing, washing your hands and not touching your face? Also how do we know how many have already recovered from it? When they are only testing very sick people. We may already be approaching herd immunity and not even realize it. That alone could be the main reason for the improvements. These trends started well before all the stupid freak out laws from the last week. They have been changing at a very consistent rate also. So the new **** hasn’t had any effect yet.But they haven't basically dropped below 1.0. In the United States they are still all above 1.0, meaning we are still in exponential growth.
I read you loud and clear on the trends-- I agree it looks way better. But four things:
-We do not know how long the days of 1.02, 1.01 1.03 could last. It could be days or weeks.
-The data of the last 10 days is a direct product or these measures. Cancelling school, cancelling public events with more than X people, banning eat-in dining, etc.
-Even when it seems clear that we have reached the inflection point, we would still be roughly halfway through our # of infections. Let's say we are able to identify a true inflection point in the next two weeks.... we would still have hundreds of thousands of infections to go.
-Finally, curves like this only work if variables remain constant. If we declare victory early and remove a lot of these measures, we could easily see the GF skyrocket again.
Not enough tests to truly tell...many places not even testing people that have it...just saying stay home and hunker down unless you need medical attention.
Plus we should start seeing results of social distancing but if we stop it will just go right back to exponential growth.
Really does look like closing bars, restaurants, and schools holds the key:
https://www.nytimes.com/2020/03/30/health/coronavirus-restrictions-fevers.html
Reduces America to East Coast and Then just South Carolina! This dude is Scared backwards lolRight, but I want to see a graph with what’s specifically happening in America, considering we can’t trust the numbers from a lot of other countries.
Reduces America to East Coast and Then just South Carolina! This dude is Scared backwards lol
Reduces America to East Coast and Then just South Carolina! This dude is Scared backwards lol
Also have you considered that any improvement in the curve is directly related to the extreme measures that have been taken? I’m not sure this graph even helps your argument...it seems like it proves that these measures are working. And what are the lies you keep referring to?
I am in the highest risk group and had a terrible sinus infection for the last three weeks and I couldn’t get tested!! Only the very obviously very sick people are getting tested. As testing ramps up it will prove that more people have already recovered than previously thought. They won’t be new cases. The most distributed test with be an antibodies test of the next month. 3.5 million of them hit the UK tomorrow and in a week or two here in the us. Not one positive test will count as a new case as they will all be considered as recovered. They will be added to last months new cases.Im not scared of anything I wasn’t correctly reading your graph at first cause it’s on my phone and I can’t see the whole thing at once. I did not see that it said US at the top. If the curve continues that way then I’m all for it, but what are you gonna do if testing ramps up and it goes in the other direction again? Also, I’m just pointing out to you that in the state in which I live, we saw the single highest number of new cases yesterday that we’ve seen so far.
I am in the highest risk group and had a terrible sinus infection for the last three weeks and I couldn’t get tested!! Only the very obviously very sick people are getting tested. As testing ramps up it will prove that more people have already recovered than previously thought. They won’t be new cases. The most distributed test with be an antibodies test of the next month. 3.5 million of them hit the UK tomorrow and in a week or two here in the us. Not one positive test will count as a new case as they will all be considered as recovered.
The UK is about to be able to use 3.5 million test for Covid-19 antibodies that give results in less than fifteen minutes. It will be interesting to see how many have already had it and recovered. ENJOY!I guess we will see. I don’t know where the evidence of that assertion is located...
PS hopefully they can start getting these positive people to donate plasma to treat the truly ill in mass.The UK is about to be able to use 3.5 million test for Covid-19 antibodies that give results in less than fifteen minutes. It will be interesting to see how many have already had it and recovered. ENJOY!
https://www.google.com/amp/s/www.te...navirus-test-covid-19-home-antibody-kits/amp/
https://www.google.com/search?client=safari&channel=iphone_bm&sxsrf=ALeKk01DJOqrb32EOEIMPqWsHGQ9j3JSeQ:1585511922251&ei=8v2AXu_ZDu2m_QbOtKa4BQ&q=uk+coronavirus+3.5+million+test&oq=uk+coronavirus+3.5+million+test&gs_lcp=ChNtb2JpbGUtZ3dzLXdpei1zZXJwEAMyBQghEKABOgQIIxAnOgcIABCDARBDOgQIABBDOgIIADoFCAAQgwE6BQghEKsCUJ5CWISWAWDxngFoAHAAeACAAekBiAGWGJIBBjIuMTcuM5gBAKABAQ&sclient=mobile-gws-wiz-serp
Im not scared of anything I wasn’t correctly reading your graph at first cause it’s on my phone and I can’t see the whole thing at once. I did not see that it said US at the top. If the curve continues that way then I’m all for it, but what are you gonna do if testing ramps up and it goes in the other direction again? Also, I’m just pointing out to you that in the state in which I live, we saw the single highest number of new cases yesterday that we’ve seen so far.
That is awesome. Thanks for posting.Really does look like closing bars, restaurants, and schools holds the key:
https://www.nytimes.com/2020/03/30/health/coronavirus-restrictions-fevers.html
It seems like you are only looking at what you want to be true and ignoring what’s happening in America.
I've been as brutally honest about the data on here for weeks, but I have to admit that I think there is potential here.
Where the disagreement with BigTimeTiger comes in is what to do with the data. It seems that BTT's response to the encouraging news is "see? This is all a bunch of BS to sink Trump and is unnecessary."
What I and the original OP are saying is that these social distancing measures are working, and now is the time to truly ramp these measures up to finally flatten the curve.
Biggest reason for this was there being a backlog of test that couldn't be read due to not having the reagent necessary to read the test. They finally got the chemical they needed and that's the biggest reason for the huge spike we saw Monday. Truthfully it was more representative of the previous week than a single day spike.
The UK is about to be able to use 3.5 million test for Covid-19 antibodies that give results in less than fifteen minutes. It will be interesting to see how many have already had it and recovered. ENJOY!
https://www.google.com/amp/s/www.te...navirus-test-covid-19-home-antibody-kits/amp/
https://www.google.com/search?client=safari&channel=iphone_bm&sxsrf=ALeKk01DJOqrb32EOEIMPqWsHGQ9j3JSeQ:1585511922251&ei=8v2AXu_ZDu2m_QbOtKa4BQ&q=uk+coronavirus+3.5+million+test&oq=uk+coronavirus+3.5+million+test&gs_lcp=ChNtb2JpbGUtZ3dzLXdpei1zZXJwEAMyBQghEKABOgQIIxAnOgcIABCDARBDOgQIABBDOgIIADoFCAAQgwE6BQghEKsCUJ5CWISWAWDxngFoAHAAeACAAekBiAGWGJIBBjIuMTcuM5gBAKABAQ&sclient=mobile-gws-wiz-serp
You need to educate yourself on what a logorithmic graph is because right now your comment in bold makes you look very foolish.He’s also using a logarithmic graph to show the flattening of the curve. New
I does appear the measures are working. While the number of new cases is America are still increasing daily growth appears to decreasing. The graph he posted is a logarithmic graph, making it appear the curve is flattening.. The linear graph is still increasing, while the daily new cases chart is making a turn. Click on the link and scroll down to the graphs
https://www.worldometers.info/coronavirus/country/us/
No I am asserting that all the positives will be added to new cases from last month because they are all recognized as recovered. Because they are recovered ( Recovery takes about 2-4 weeks), that’s why they have the antibodies. Therefore making the reduction in new cases even LARGER. Please use your head for something productive today.Ive seen the article, but you assert that it will prove that more people have recovered than previously thought....that’s speculation on your part. I know you want it to be true so you can say I told you so to everyone, but it’s just speculation.
I really hope at the end of all of this people who were negligent are held accountable. NY was literally telling people back in January and February to not worry about it and continue as normal. Now, they are more than 40 % of the US cases. The people of New York should be pissed and have every right to questions those people who continue to give them false information. Sad world we live in, or they live in.Really does look like closing bars, restaurants, and schools holds the key:
https://www.nytimes.com/2020/03/30/health/coronavirus-restrictions-fevers.html
They won’t because liberals are never responsible for anything bad.I really hope at the end of all of this people who were negligent are held accountable. NY was literally telling people back in January and February to not worry about it and continue as normal. Now, they are more than 40 % of the US cases. The people of New York should be pissed and have every right to questions those people who continue to give them false information. Sad world we live in, or they live in.
