Based on Flo rankings here is my attempt to squeeze too much information into a single place.
I am not sure how I feel about it. Feel free to tell me how you feel about it.
Let's start with the obvious.
The less obvious.
I am not sure how I feel about it. Feel free to tell me how you feel about it.
Let's start with the obvious.
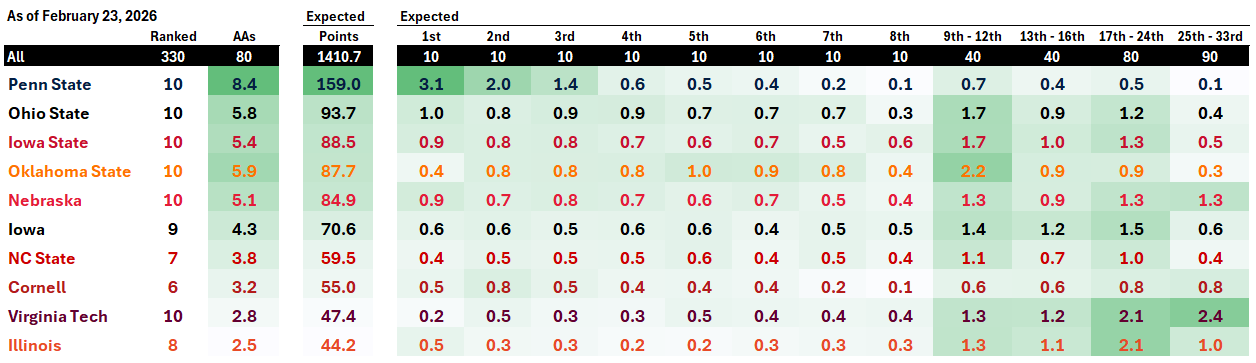
- PSU is sitting on 159 points. But as @Psalm 1 guy and I discussed over on HR, PSU has an annoying habit of outperforming the model.
- Therefore, I have created a PSU-specific adjustment (call it a fudge factor, call it bullcrap). This year it is 25.5 points.
- That would put PSU at 184.5 points. A record even I could recognize.
The less obvious.
- At 159 points there is only between a 0.3% - 5% chance anyone catches them. The lower number is the chance anOSU scores over 159. The higher number is the chance PSU scores under 93.7. There are obviously a lot of other scenarios for the ambitious in the crowd to work out.
- At 184.5 the chances drop to 0.005% - 2%.
- Given that there is only a 10% spread among Ohio State, Iowa State, Oklahoma State, and Nebraska second through fourth is a jump ball.
- Iowa - sigh. I fear the rankings have not caught up to their current state. I fear this estimate may be on the high side. There are just so many unknowns about this team. Who are the starters at four (?) weights? How injured are Ferrari and Kueter and what will they look like after being out so long?


 That said, you know what I'm using, I do think they're going to break that record again because of the in season dual dominance. And I have played with different standard deviations like you advised and other things and gotten it to align with past results much more so than it doesn't.