I'm not going to say I didn't hope/expect to be further along in 2.0's tenure when he returned. But I'm also not going to look past the impact that a lack of NIL preparedness had on where we are today. Like everything else with this athletic department for the last 2 decades, they were caught flatfooted and worse yet, seemingly ignored reality. How many examples do we need to cite? What this HC (or any that would've taken this job in December of '19) was up against with zero foresight from their President/AD cannot be understated.
Some may call it an excuse, but it's the reality. Even in '26, Rutgers ranks dead last in B1G NIL payout to their football program. Forget the Oregons, Ohio States and USCs of the world - all of whom are $20M+ ahead of RU in that department. We're $5M+ off the league average. The fact is, we're a one legged man in an ***-kicking contest. I'm encouraged when I listen to Tate and Zinn talk about this stuff. We finally seem to have adults in charge and that "vertical alignment" is crucial. The next step is doing it - whether for this HC or whoever comes next.
Ran this question through Grok on spending per team for football for 2025-26 and 2026-27.
In my humble opinion, if the numbers below are correct, there are five blue bloods, which are separated from the other 13 teams in the B1G. For those that want to get more granular, separate out Nebraska and Indiana.
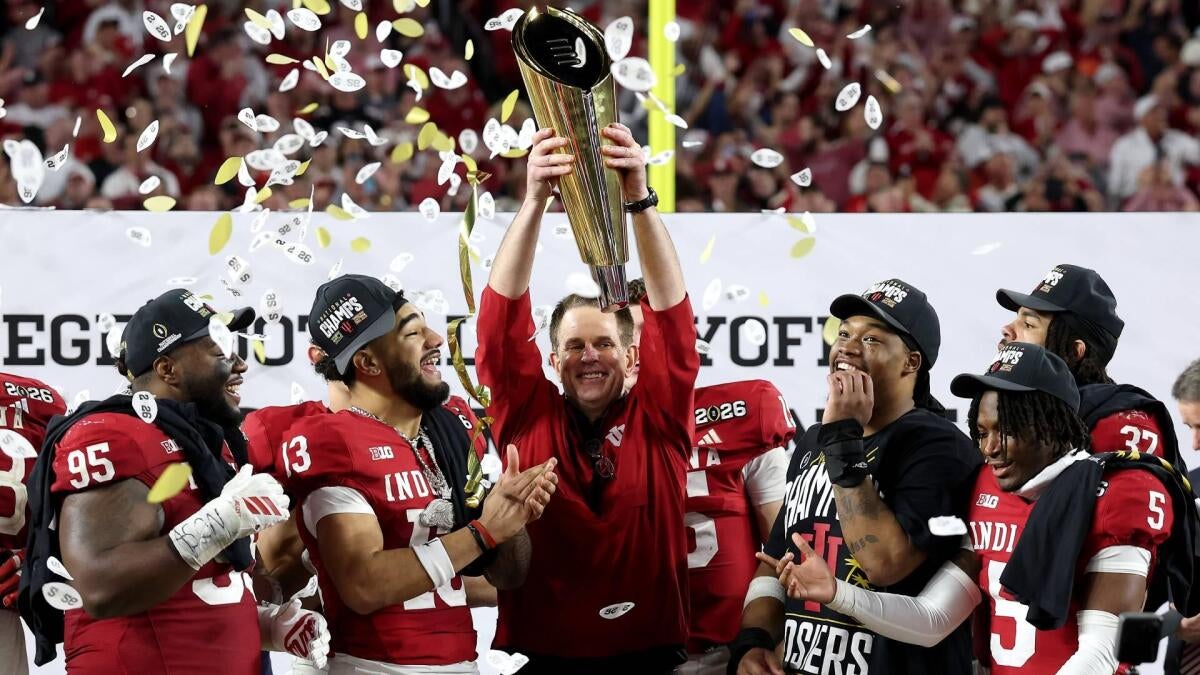
But Indiana raises a good point- how are they competing with the blue bloods? COACHING!
There is no reason Rutgers cannot compete and beat the other 11 teams in the B1G, and for that matter Nebraska, and once in a while getting a signature win against one of the blue bloods. Heck Ilinois NIL spending is on par with ours, and they are competing with and beating better teams.
2025-26 Revenue Sharing (Direct School Payments)This was the first year of formalized revenue sharing under the House v. NCAA settlement. Schools could share up to ~$20.5 million total across all sports (rising annually). Football received the large majority—typically 70-85%—at most programs, equating to roughly $14-17 million per Big Ten football team.
nil-ncaa.com
Estimated football revenue sharing allocations (examples from 2025-26 data):
- Top programs like Washington, Oregon, Penn State, Ohio State: ~$16-17M (high end due to revenue generation).
- Mid-tier (e.g., Minnesota, Illinois): ~$14-15M.
- These are derived from athletic department revenues, with football often accounting for 75-82% of relevant income.
nil-ncaa.com
Exact per-school breakdowns beyond these estimates are not publicly disclosed in full detail, as allocations vary by program (e.g., some reserved small portions for basketball/volleyball). Many Big Ten schools maxed out or came close to the cap.
nil-ncaa.com
Total Football Roster Costs (Revenue Share + Third-Party NIL/Collectives)Third-party NIL remains private, so totals are estimates. For context,
2026-27 estimates (reflecting the ongoing 2025-26 model with growth) show:Big Ten Median: ~$24.4M total per football roster
- ~$15.6M via school revenue sharing
- ~$8.8M via third-party/commercial NIL
Detailed by School (2026-27 estimates, in $ millions):
nil-ncaa.com
- Oregon: 43.4 total (15.6 rev share + 27.8 NIL)
- Ohio State: 40.4 total (15.6 + 24.8)
- USC: 34.7 total (15.6 + 19.1)
- Michigan: 33.0 total (15.6 + 17.4)
- Penn State: 29.2 total (15.6 + 13.6)
------------------------------------------
- Nebraska: 27.4 total (15.6 + 11.8)
- Indiana: 27.3 total (15.6 + 11.7)
- Washington: 26.4 total (15.6 + 10.8)
- Wisconsin: 24.5 total (15.6 + 8.9)
- UCLA: 24.3 total (15.6 + 8.7)
- Maryland: 23.7 total (15.6 + 8.1)
- Iowa: 23.6 total (15.6 + 8.0)
- Michigan State: 23.1 total (15.6 + 7.5)
- Minnesota: 22.6 total (15.6 + 7.0)
- Illinois: 21.9 total (15.6 + 6.3)
- Rutgers: 21.3 total (15.6 + 5.7)
- Northwestern: 21.0 total (15.6 + 5.4)
- Purdue: 20.4 total (15.6 + 4.8)
Notes on these figures:
- They represent estimated annual roster-wide spending (not per-player averages; top players command far more).
- NIL layers are conservative estimates based on donor activity, collective reports, and athletic revenues. Actuals can fluctuate with portal deals and front-loading.
nil-ncaa.com
- Top teams (Oregon/OSU) push elite spending; the gap to the bottom tier is significant.


 )
)